I was working on a dashboard for a client the other day with multiple data sources. I created a set to collect members of a field and added a set action on the dashboard to allow the users to dynamically change the members of the set from the dashboard. The client added a new data source for some additional visuals needed on the dashboard. While data filters can apply across multiple related data sources, sets cannot. I needed a way to pass multiple values across these two data sources: multi-select parameter!
For years, parameters could only be a single value passed through to filters, calculations, reference lines, etc. Starting in 2019.2, parameter actions changed all this.
In the example below, a user can select any bar or bars to select the sub-categories used for analysis against the total sales in the donut chart on the right. The view at the bottom right then shows the individual sales for each sub-category.

To add this functionality to the dashboard, we need three things:
- A Parameter
- Calculation using parameter
- Parameter Action on the dashboard
Create Sub-Category Parameter
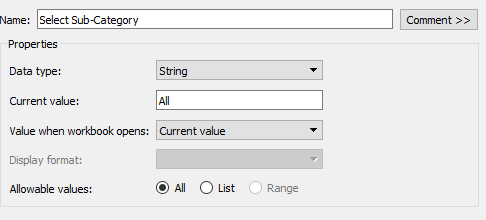
Create a string parameter with current value set to “All”. When the workbook opens, have it use that current value. Be sure to allow all values as possible entry for the parameter.
Create Selected Sub-Categories calculation
Using the parameter, create a boolean calculation to select which sub-categories to include in the view. If the value is the default value of “All” set the value of calculation as True. Otherwise, use the CONTAINS function to check if the sub-category value is contained within the Select Sub-Category parameter and if it does, assign this as True. Otherwise, the calculation is False.
IF [Select Sub-Category]=’All’ THEN TRUE
ELSEIF CONTAINS([Select Sub-Category],[Sub-Category]) THEN TRUE
ELSE FALSE
END
Use Selected Sub-Categories on Color
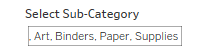
The Selected Sub-Categories calculation can be used on color on both the bar chart and the donut chart to color code the bars/part of donut associated with the selected sub-categories. For now, all the bars and the entire donut chart is the same color as the parameter value is currently set to All. To test out the functionality of the calculation, show the parameter control and change the value Chairs. The Chair bar and part of the donut chart will be a different color from all other sub-categories.
Add Parameter Action to Select Sub-Categories
The key to creating the multi-select parameter is the parameter action. Create a new parameter action.

Use the bar chart as the source of the action. Run the action on Select. Set the Target as the parameter created above (Select Sub-Category). The field to use as the value for the parameter is Sub-Category. Set the aggregation to Concatenate. Concatenating the values will concatenated line of multiple selected sub-categories.
The Selected Sub-Categories calculation uses this concatenated list to check if it contains the sub-categories. Lastly, set the parameter action to use the “All”: value when the selected is cleared so clicking off a sub-category or multiple sub-categories will show all sub-categories. The parameter control is no longer needed on the dashboard as the bar graph is used to pass the sub-categories through the rest of the dashboard.
I was able to incorporate this solution for my client by creating similar calculations in each data source based on the single parameter. A parameter action on the dashboard changed the value of the calculations in both data sources based on user interaction that I couldn’t do with set actions. There are many other uses for parameter actions and over the next few months, I’ll post some of my favorite parameter action use cases.
