When I first started to learn Tableau, I first went to the Tableau website and watched every training video. I played around with Superstore and quickly jumped into using my own business data. I began by duplicating existing Excel reports in Tableau, but eventually branched out and started creating my own true dashboards. I was one of the few people in my department actively using Tableau. Because of this, I didn’t really have anyone I could go to for advice or assistance. Thank goodness for the amazing Tableau community! I would search the forums for ideas for different types of dashboards, and more importantly answers to questions on how to get Tableau to do exactly what I wanted it to do.
That was in 2012, and in the years since I have learned more from the Tableau community than I ever could from videos or training classes. I have downloaded countless workbooks from the forums and Tableau Public, pulled these workbooks apart, and advanced my Tableau skill set by learning from what others have done. I have developed my method for reverse engineering Tableau workbooks.
I had the opportunity to present this topic at both the 2017 Tableau User Conference and the 2017 Tableau Fringe Festival. These are some of the highlights of that presentation.
Note: a video of the presentation from the TFF will be available soon and will be linked here once available.
What is Reverse Engineering?
Reverse engineering…is the process of extracting knowledge or design information from anything man-made and reproducing it or reproducing anything based on the extracted information. – Wikipedia
Put simply with regards to Tableau, it is the process of taking a workbook, dashboard, or visualization and deconstructing it to understand how it was created so that you can both learn from it and use to recreate in your own visualizations.
Normally, when we create something in Tableau, we start with requirements that lead us to a specific design and ultimately the final implementation.
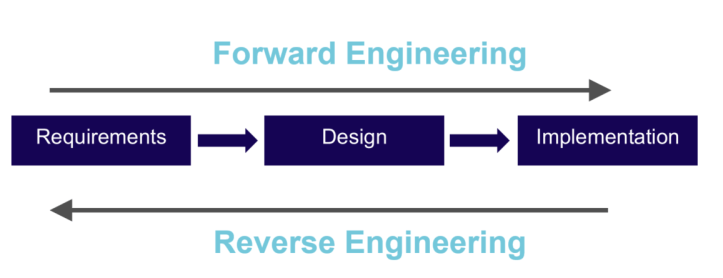
But with reverse engineering, we start with that final implementation and seek to understand how it was designed and what the requirements are to be able to replicate something similar in a different use.
When to Reverse Engineer?
- Taking over someone’s existing workbooks
- Troubleshooting
- Using someone’s workbook for inspiration
- Tableau Public
- Co-workers
- Blogs
- Other sources
- Learn new techniques
- Understand how Tableau works
Reverse Engineering Techniques
The following are by no means the only techniques to reverse engineer in Tableau — but these are the ones that I have come to use over time.
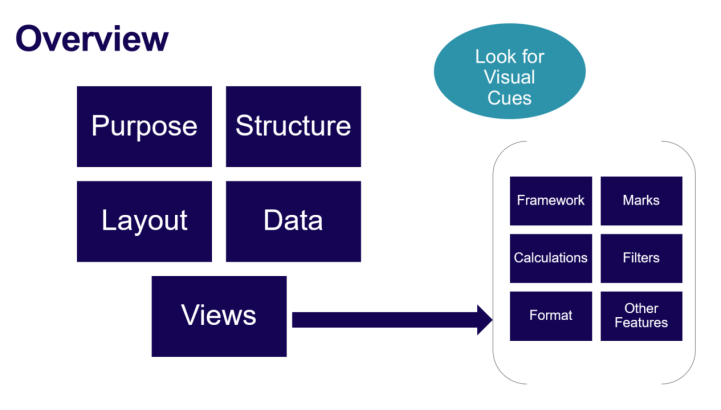
I try to follow a similar process each time, focusing on the areas listed above and outlined further in this post.
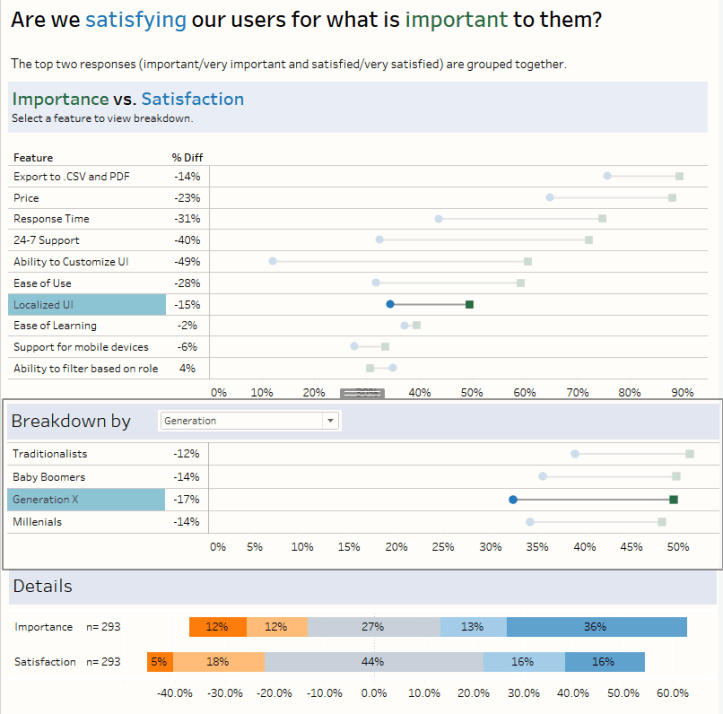
In the example scenario I have a client that has survey data. I do not often work with survey data so I searched for an example from the community. I found a dashboard by Zen Master, Steve Wexler. The goal was to understand how he created his dashboard via reverse engineering to be able to take some of the same techniques for use with my client.
What is the purpose?
- Open the dashboards in presentation view
- Play around with the dashboard
- Is there connectivity between views?
- What are the titles/supplemental text telling you?
- Who is the audience?
Examine the structure of the workbook
- How many dashboards?
- What about story points?
- What are the worksheets?
- Is there anything hidden?
- If multiple dashboards, are any connected via actions?
Explore layout of dashboards/stories
- How many worksheets on each dashboard/story?
- Which ones?
- Are they tiled or floating?
- How do filters affect views on dashboard?
- Are there actions?
- Are there device specific layouts?
Examine data sources
- What data sources are used?
- Are there joins, cross-database joins, unions?
- Are the any blended sources?
- View each data source:
- Properties
- Sample Data
- Explore dimensions/measures
For each view on a dashboard/story, I look at six additional topics:
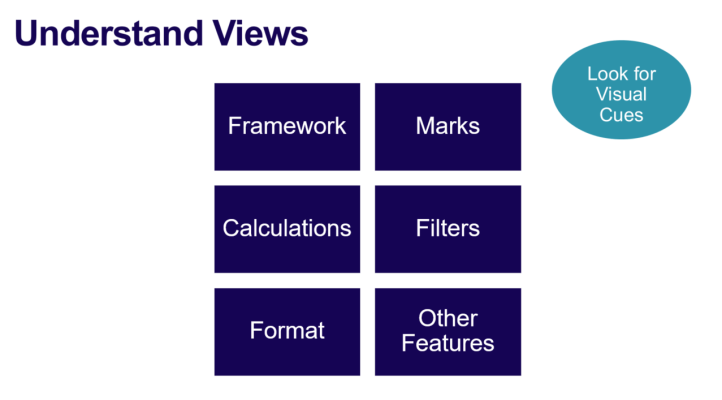
Understand Views – Framework
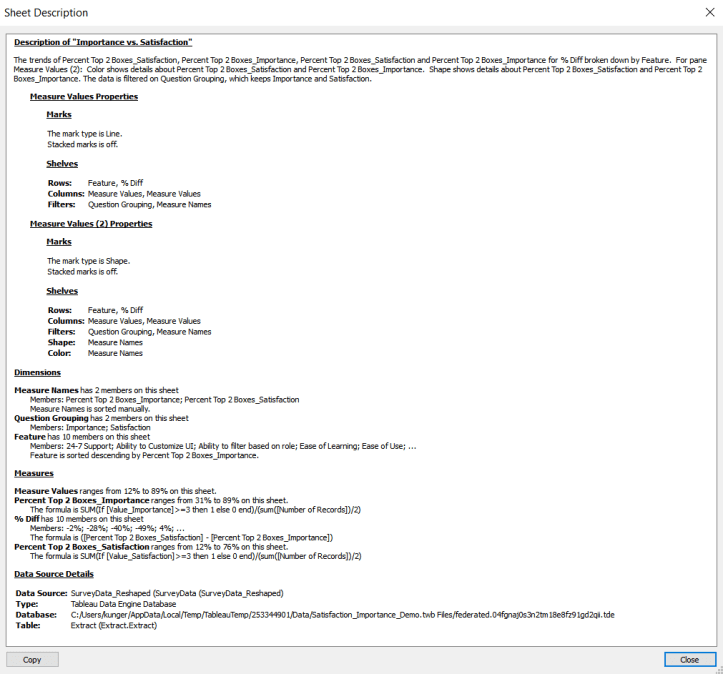
- Use Sheet Description to see framework of each view (CTRL + E)
- Examine dimensions/measures in view
- What is on columns, rows?
- What is discrete? Continuous?
- Are there any fields on shelf but hidden to user?
Understand Views – Marks
- What type of chart/mark?
- Is there share axis or dual axis?
- Examine the marks card:
- Color
- Size
- Labels
- Level of Detail
- Tooltips
Understand Views – Calculations
- Does the view use calculated fields?
- Are there comments in the calculations?
- Can you trace the calculations to their source fields?
- Are there table calculations? If so, how are they computed?
- Are there Level of Detail calculations?
Understand Views – Filters
- Are there any filters visible to the user?
- Are there any filters NOT visible to the user?
- Are any filters context filters?
- Do the filters apply to more than this worksheet?
- Does the filter include or exclude data?
- Are the filters based on:
- List of values?
- Continuous range?
- Top N?
- Formulas?
Understand Views – Format
- Text
- Fonts
- Alignment
- Color
- Borders
- Lines
- Axes
- Legends
Understand Views – Other Features
- Are there any reference lines, bands or distributions?
- Are there parameters? How are they incorporated?
- Are there any actions?
- Is the data sorted? How?
- Are there…
- Hierarchies?
- Groups?
- Sets?
Using the Tableau Community for Inspiration
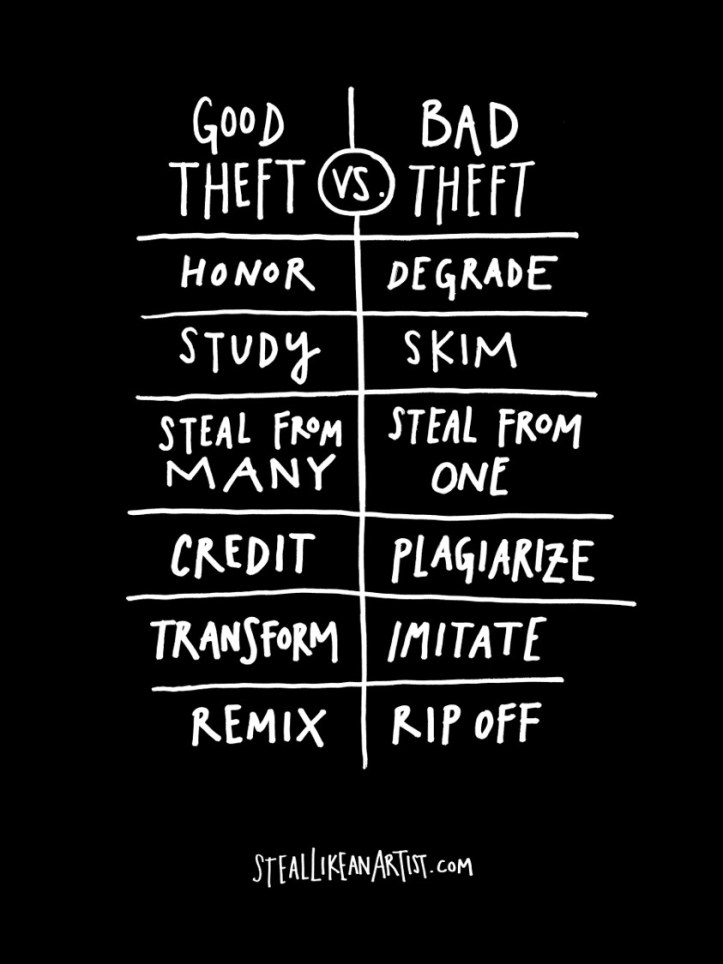
In the beginning, we learn by pretending to be our heroes. We learn by copying. We’re talking about practice here, not plagiarism – plagiarism is trying to pass someone else’s work of as your own. Copying is about reverse engineering. It’s like a mechanic taking apart a car to see how it works.
– Austin Kleon – Steal Like an Artist
There are numerous resources within the Tableau community from which to draw inspiration.
Tableau Public
Visualizations from more than 100,000 authors
Search topics, authors, view gallery
Viz of Day / Viz of Week
If the author has allowed it, you can download the workbook directly from Tableau Public to reverse engineer.
Example:
Rody Zakovich – Boston Red Sox Every Season Visualized
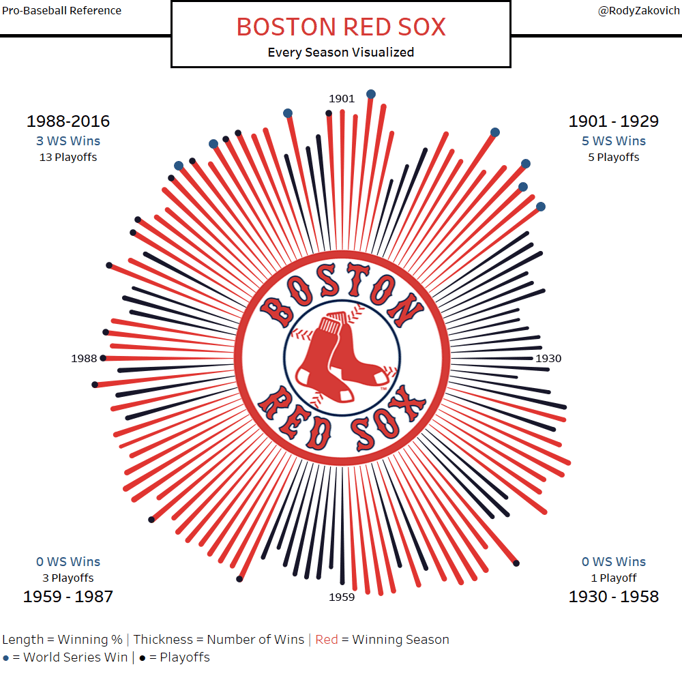
Key learnings from Rody’s dashboard:
- Structure for data source
- Use of trigonometry to create radial chart
- Use of background image to insert logo
- Dual axis to add points to end of lines
From this, I was able to replicate using my Alma Matter’s basketball history:
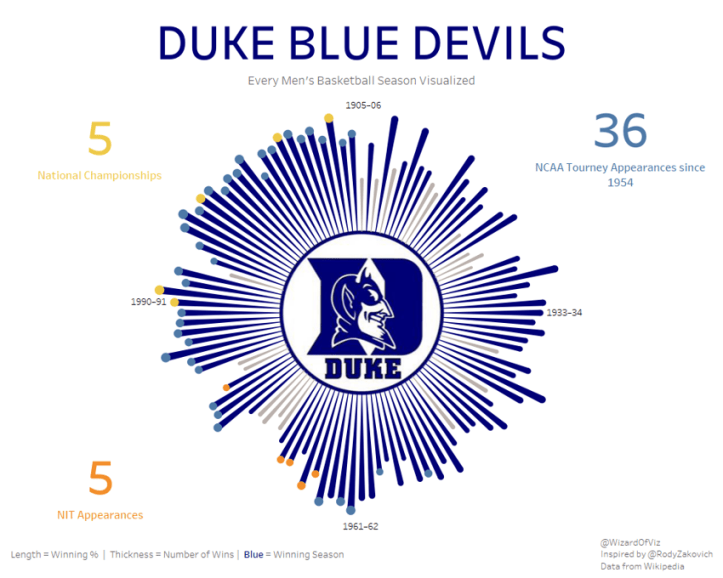
I created a similar data source, replicated the techniques, and now that I am familiar with this process, I can use it elsewhere.
Community Activities
Another great place for inspiration are activities sponsored from within the community. The following are my favorites:
Makeover Monday – Each week, a link to a visualization and data set is provided for you to rework the chart. Find a new story and redesign the existing one. The true value of this exercise is the vast differences in how every participant chooses to display the same set of data.
Workout Wednesday – Each week, a different set of requirements are provided along with a picture of the visualization created in Tableau. Your goal is to replicate the visualization. With each challenge, I learn something new to incorporate into my Tableau skills set.
Viz for Social Good – This community activity incorporates beautiful and informative data visualizations for mission-driven organizations to promote social good and understand their own data. A project is by an organization with the data and requirements. Volunteers generate visualizations for the organization to use as they wish. The end results are stunning and impactfull.
Other Resources
Be sure to follow your favorite Tableau blogs, social media accounts and Tableau forums. All provide ample opportunities to reverse engineer and learn more about Tableau.
 Remember, even the Beatles started out as a cover band…finding inspiration from many until they created their own sound.
There are many sources of inspiration out there but…
Be sure to give credit where credit is due!
A video of the presentation given at the Tableau Fringe Festival will be posted online soon. Be sure to check back for the link once available.
