One of my personal goals for 2018 is to become a better story teller. As a consultant, I am often restricted to telling the story my clients want to hear. All too often, I find this story to be too all-inclusive and lacking focus. But, hey, that’s what the clients want. But when it comes to projects where I have more say in the matter, it seems all too often that this style that I am so often used to accommodating for takes over. Lately, I have found it more difficult to focus my visualizations into a single powerful arching story.
Towards the end of 2017 I started seeking out resources to help me become a better story teller, or more specifically, return to a time of simply being able to tell even a single story. I had previously read some blog posts by Cole Nussbaumer Knaflic and decided to revisit it once again. To my pleasant surprise Cole had recently started a podcast, and I quickly made time to listen to these while playing in a recent poker tournament. Her first episode resonated strongly with me with how to provide feedback to others on visualizations, and more specifically to consider the constraints at which someone had when creating their visualization. I think we miss this fact way too often.
I was excited to see when Cole had started a new monthly challenge. I love participating in these community activities. The goal of the challenge is simple: “create a safe space each month where you could take a turn flexing your skills or trying something you haven’t attempted before”. For this first challenge, the task was to create an annotated line graph. You could choose any data source, as long as it didn’t contain confidential data. I went back and forth on a bunch of topics, but ultimately landed on one of my favorite: baseball.
Nearly twenty years ago, America was transfixed on the home run race between Mark McGwire and Sammy Sosa. I created a visualization based on data from ESPN.com to track that race and their quest to set a new home run record.
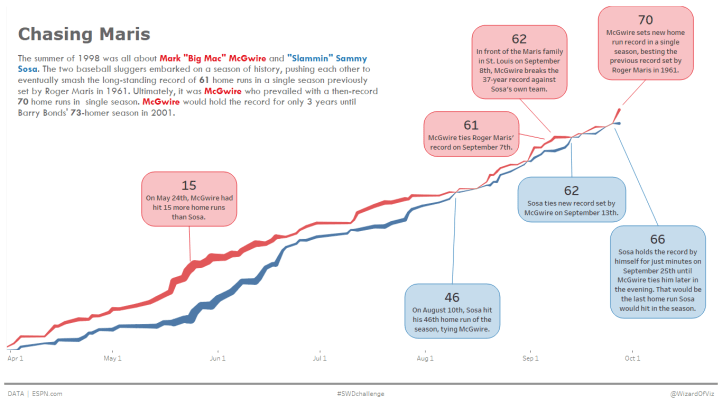
I chose to annotate some key moments in the summer:
- McGwire started out the summer with a large lead over Sosa, as high as 15 home runs ahead by May 24th.
- But by August 10th, Sosa and McGwire were all tied up at 46 home runs each.
- McGwire was the first to break the record — doing so against Sosa’s Cubs and in front of Roger Maris’ family on September 8th
- Just 5 days later, Sosa also reached the magical 62 number.
- Sosa help the record alone at 66 for only a few minutes as McGwire tied it up later in the same evening.
- McGwire went on to hit 4 more home runs before the end of the season, to set a then-record 70 home runs in a single season.
The lines are color coded based on the player – McGuire in red (for the St. Louis Cardinals) and Sosa in blue (for the Chicago Cubs). The width of the lines represent the differential between the two sluggers home run tallies.
I don’t often get to create these type of visualizations and I enjoyed determining what to annotate and how to tell the story of the summer through graph, introduction, and annotations.
I look forward to the next month’s challenge.
