It’s a new year and with it comes a new team of curators for my favorite weekly activity: WorkoutWednesday. This week, Zen Master Rody Zakovich took over the reigns. Joined by Luke Stanke, the two rolled out a new website for the challenge. I have admired Rody’s work over the years and look forward to what he is has in store for us this year. And it seems as if Luke is definitely ready to come up with his own puzzling exercises.

This week’s challenge:
 Requirements
- Fiscal Year start can be configured via a Parameter
- X Labels should match the Fiscal Year Start
- X Axis must be Continuous
- Should be 1 color per fiscal year
- Tooltips should match mine
- The data is superstore. Use your own version or get a copy at data.world.
How did I solve it?
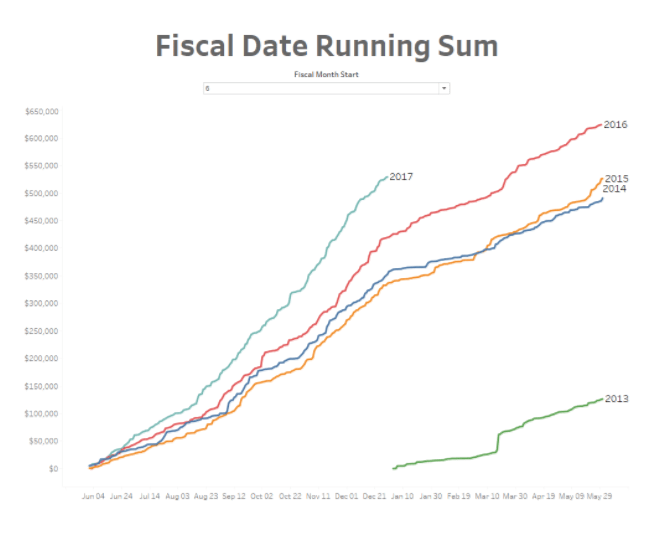
The view is a line graph showing a running sum of sales (quick table calculation) with a separately colored line for each fiscal year. The fiscal year is based on a parameter (Fiscal Month Start) to select the first month of the fiscal year.
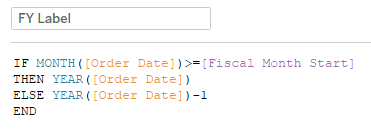
Fiscal year labels were created by comparing the Month of Order date to the Fiscal Month Start parameter value.
Biggest Challenge:
I’m not going to lie. I went to Rody’s Tableau Public version of the exercise to try to check one thing.
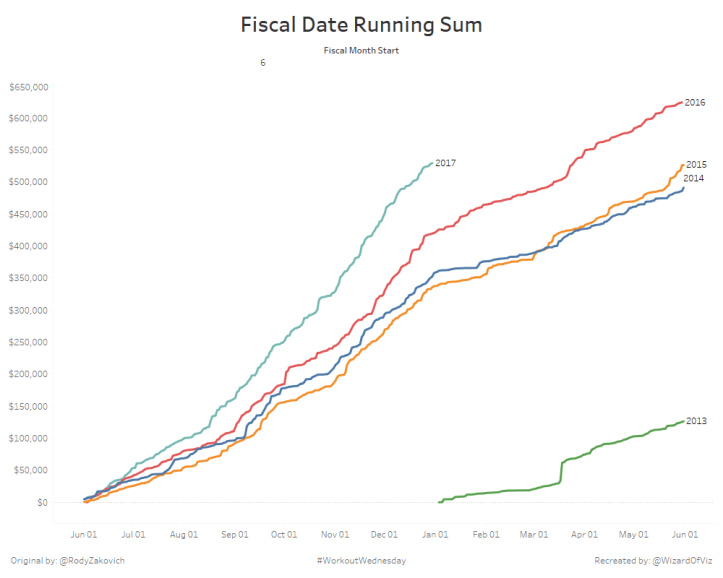
On his view, the labels on the X-axis never repeat (when looking at month 6). On mine, however, it repeats Jun 01. This seems to be because of the automatic date range which calculates based on what is in the view. I couldn’t for the life of me get it to not repeat. I selected different months in Rody’s viz and noticed that when month 7 was selected, he also got some repetition.
Anyone know how to make the axis not repeat the starting month again? I’d love to be able to download Rody’s viz to see what he did to maybe figure out why some repeated and some did not.
Coolest Trick:
To be able to have the dates show as a daily trend showing one year on the axis, it required converting all dates to fall within a single 12-month time period. Splicing the lines by the calculated FY Label gives us a line for each of the calculated fiscal years.
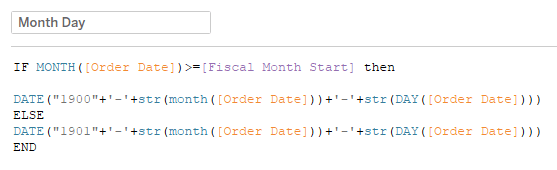
I used arbitrary years of 1900 and 1901 to assign for my new created Month Day field. If the MONTH(Order Date) is greater than or equal to the selected start month of the fiscal year, then the date will use the year of 1900 along with the month and day of the original Order Date. If the MONTH(Order Date) is less than the selected start month of the fiscal year, then the date will use the year of 1901.
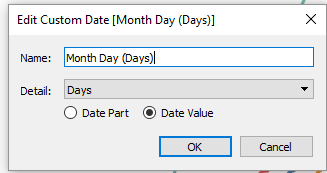
Transforming the dates creates a single 12-month axis time period to visually display the fiscal years. From this field, I created a custom date to set the date to only display as days and not allow for any drill down (as dates have a natural drill down hierarchy in Tableau).
This was a good starting challenge. I got to practice using date calculations, quick table calculations, parameters, and custom dates. I look forward to 50 more weeks of this in my continuing quest to expand my Tableau skills set.
